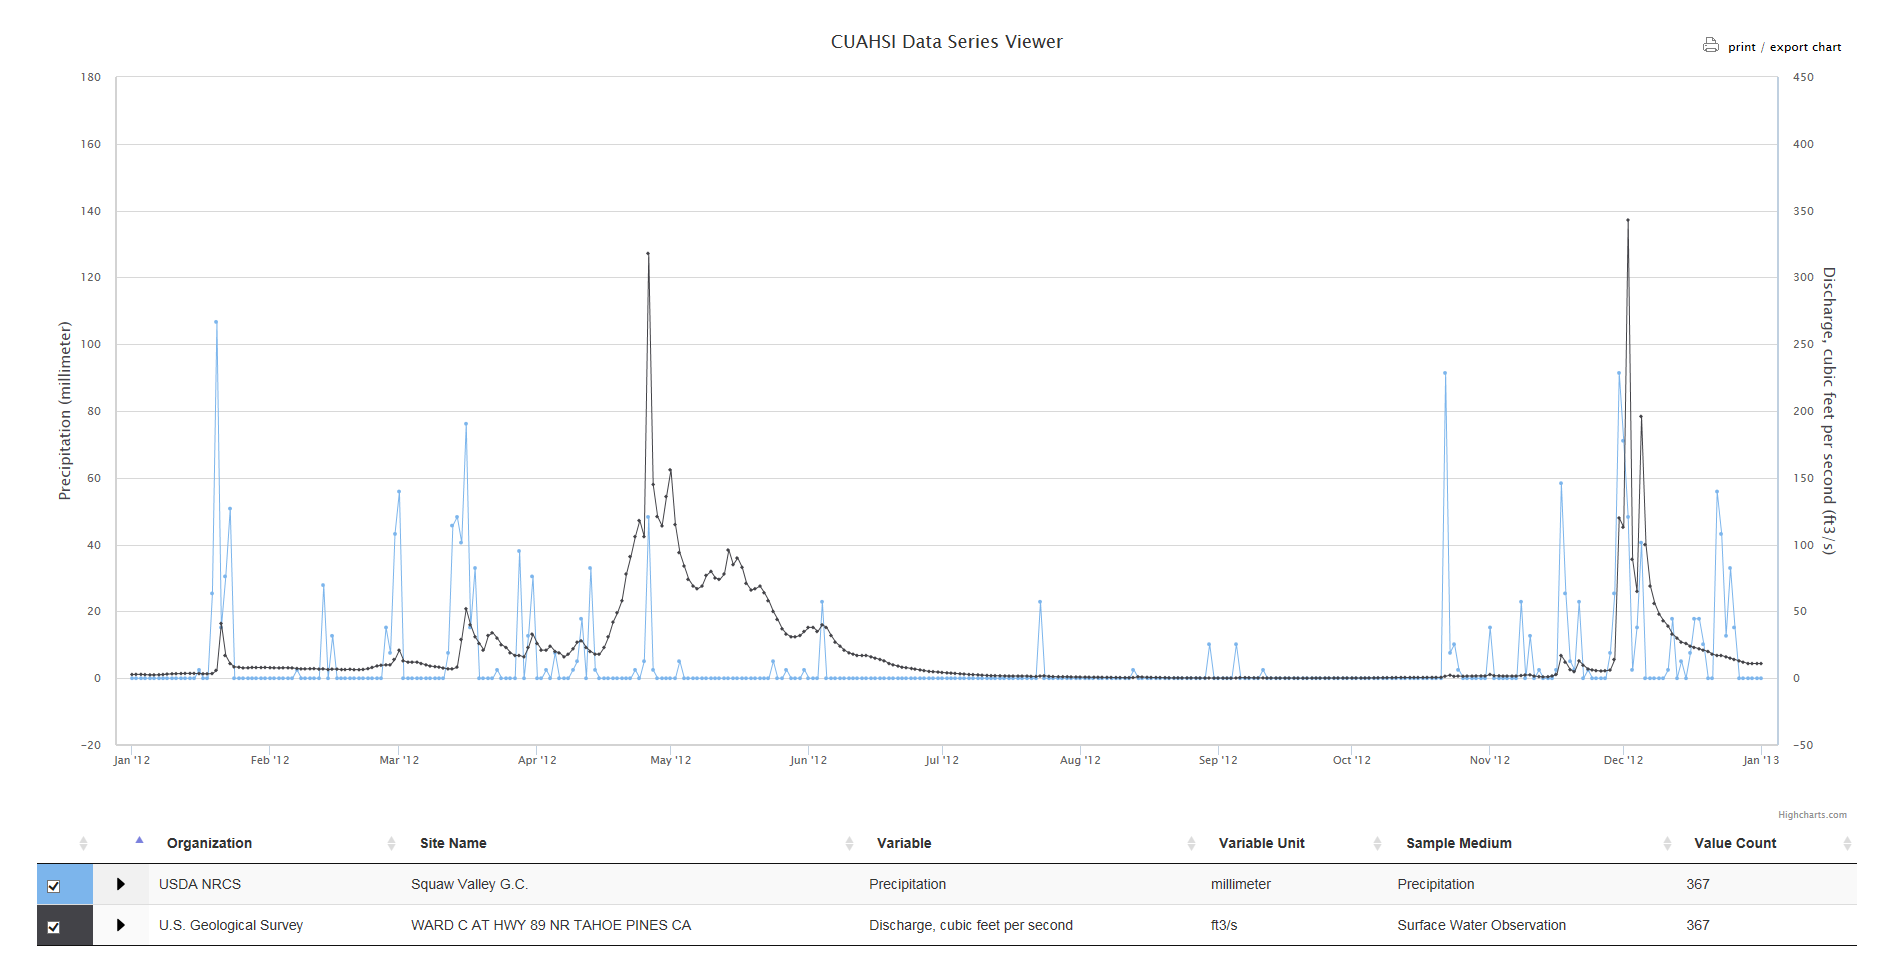
The Data Series Viewer graphs up to five different data series with up to two different units at a time. The Data Viewer also now includes a box and whisker plot, summary statistics, and additional metadata for each data series. To access the Data Series Viewer, first you must complete a search and save one or more data series to your Workspace. If you are unsure how to search for and save data to your Workspace, please visit the following articles: Searching for Data and Saving Data to the Workspace
In the Workspace, click on up to five different rows at a time to highlight the data series you are interested in. Remember, the Data Series Viewer can graph up to five different data series and two different units at a time, so keep that in mind when selecting data series to view. After highlighting data series, click on the Select Tool dropdown and choose Data Series Viewer as shown below. Click the Launch Tool.
The Data Series Viewer shown below, will launch in a new browsing window.

To get a closer view of a particular range of time on the graph, click and drag your mouse over a section as shown below.
To reset the graph, click on the Reset zoom button located at the button left as shown in the zoomed in graph below.
Notice that each data series line is color coded to match the associated row of metadata below. If you click on the arrow next to a row of metadata, additional information will appear, as well as a box and whisker plot for the individual data series as shown below. You can also use the check box to toggle a data series on or off in the Viewer.
To understand the metadata displayed above, visit the article: Interpreting Metadata
0 Comments